A cash flow forecast for your household
A budget tells you what a category can spend. A cash flow forecast tells you what your bank balance will be on Tuesday the 12th, after rent has gone out and before the paycheck lands. Forecast Commander is a complete budgeting app that has the second one built in, so every bill and paycheck you enter answers the same question: are you still clear next month?
What a forecast is
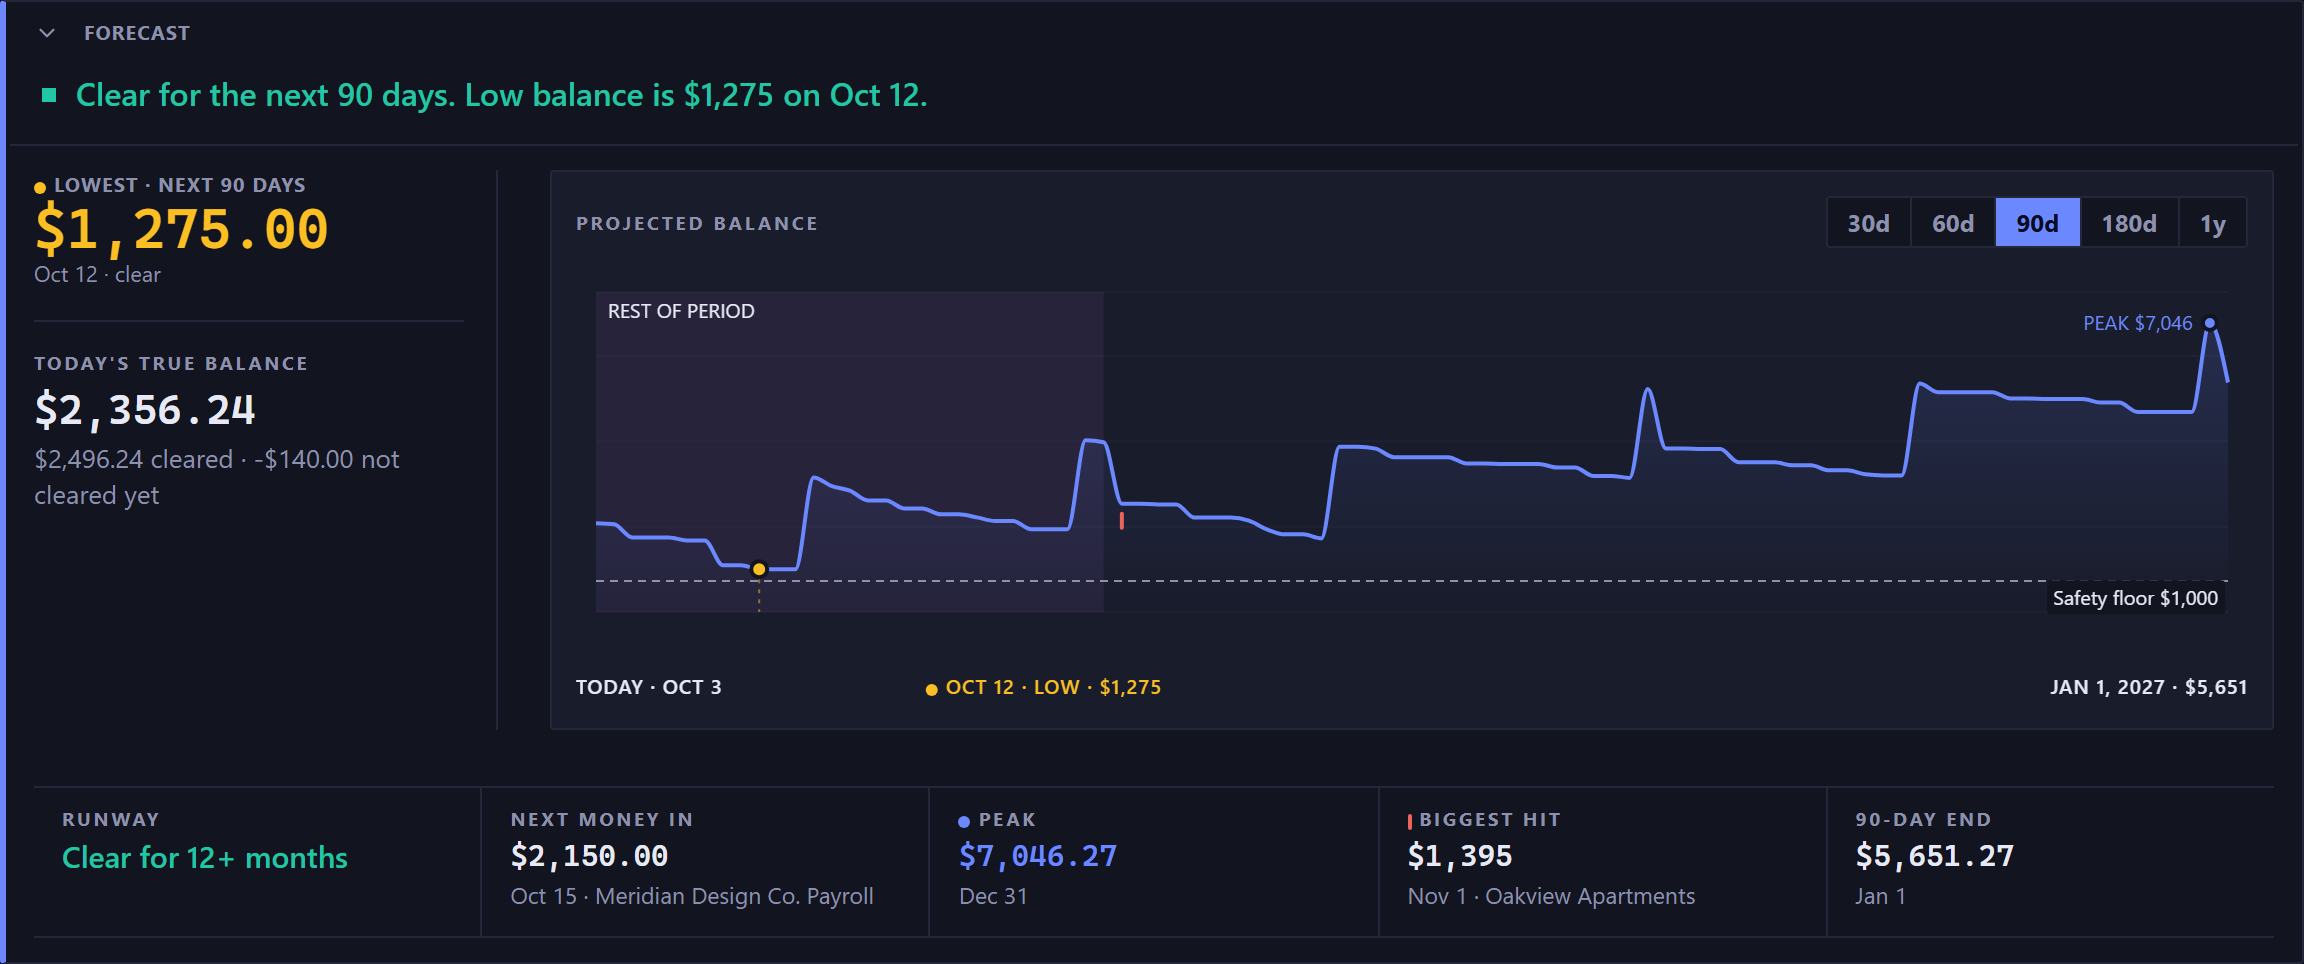
Take every bill and paycheck you know about and put it on the day it happens. Now read the balance at the end of each day, in order, from today forward. That's the forecast. The calendar shows it directly: every day carries its own running balance in the corner and the items that moved it underneath. A paycheck raises the line on the 15th; rent drops it on the 1st; a buy-now-pay-later installment takes its piece on the 22nd.
Reading the low point
Somewhere in the next 90 days the line touches its lowest, and the panel above the calendar says so first, in one of three ways. When you stay above your floor, it names your low balance and its date. When the balance dips below your floor, it names the day and how far below, and See what causes it lists the payees pushing you down, largest first. When the balance goes below zero, it names the day, and that list is already open.
Along the bottom of the panel sits runway: how long you stay above your floor if nothing changes.
Why the spreadsheet stops working
Many people already do this in a spreadsheet, and it works, until it doesn't. It's 52 weeks of running balances, every recurring row copied forward by hand, and a formula that breaks when a paycheck moves. The spreadsheet is powerful and it's tedious, and the tedium is why it goes stale in March. The app keeps the speed and control of a ledger you write yourself and does the copying forward for you, because a rule entered once runs for as long as you keep it.
What you do with it
Ask whether a purchase fits, and get a date: the first day it clears without touching your floor. Try a change before you make it, a new bill, a raise, a bill stopped, and read what moves. See the seasonal spikes coming, December and April and back to school, months before they arrive, with the balance already counted. Reserve money for a goal on a schedule and see what's left after it. Every one of those is the same forecast, read a different way.
What it needs from you
An account with today's balance. The paychecks and the bills you know are coming, each entered once as a rule with its amount and its day. A statement export from your bank, if you'd rather have the statement reader propose the rules than type them. That's the whole setup, and it's front-loaded and finite: a rule entered in September is still running in March. The forecast is only as complete as the rules behind it, so a good habit is a statement export now and then, to catch the bill you forgot to tell it about.
It's free for 35 days, and there's no card to enter. Read the Command Center guide.