Skip to the page

The forecast and runway

The forecast is your balance carried forward a day at a time, over the things you've already told it about.

The screenshots are live captures of a demo account.

Last updated

Arithmetic on what you've told it#

The forecast takes today's balance, puts everything you've told it about on a calendar, and carries the balance forward one day at a time. Nothing is inferred, learned or guessed.

When it's wrong, a fact has changed, and you can find that fact and fix it in one edit.
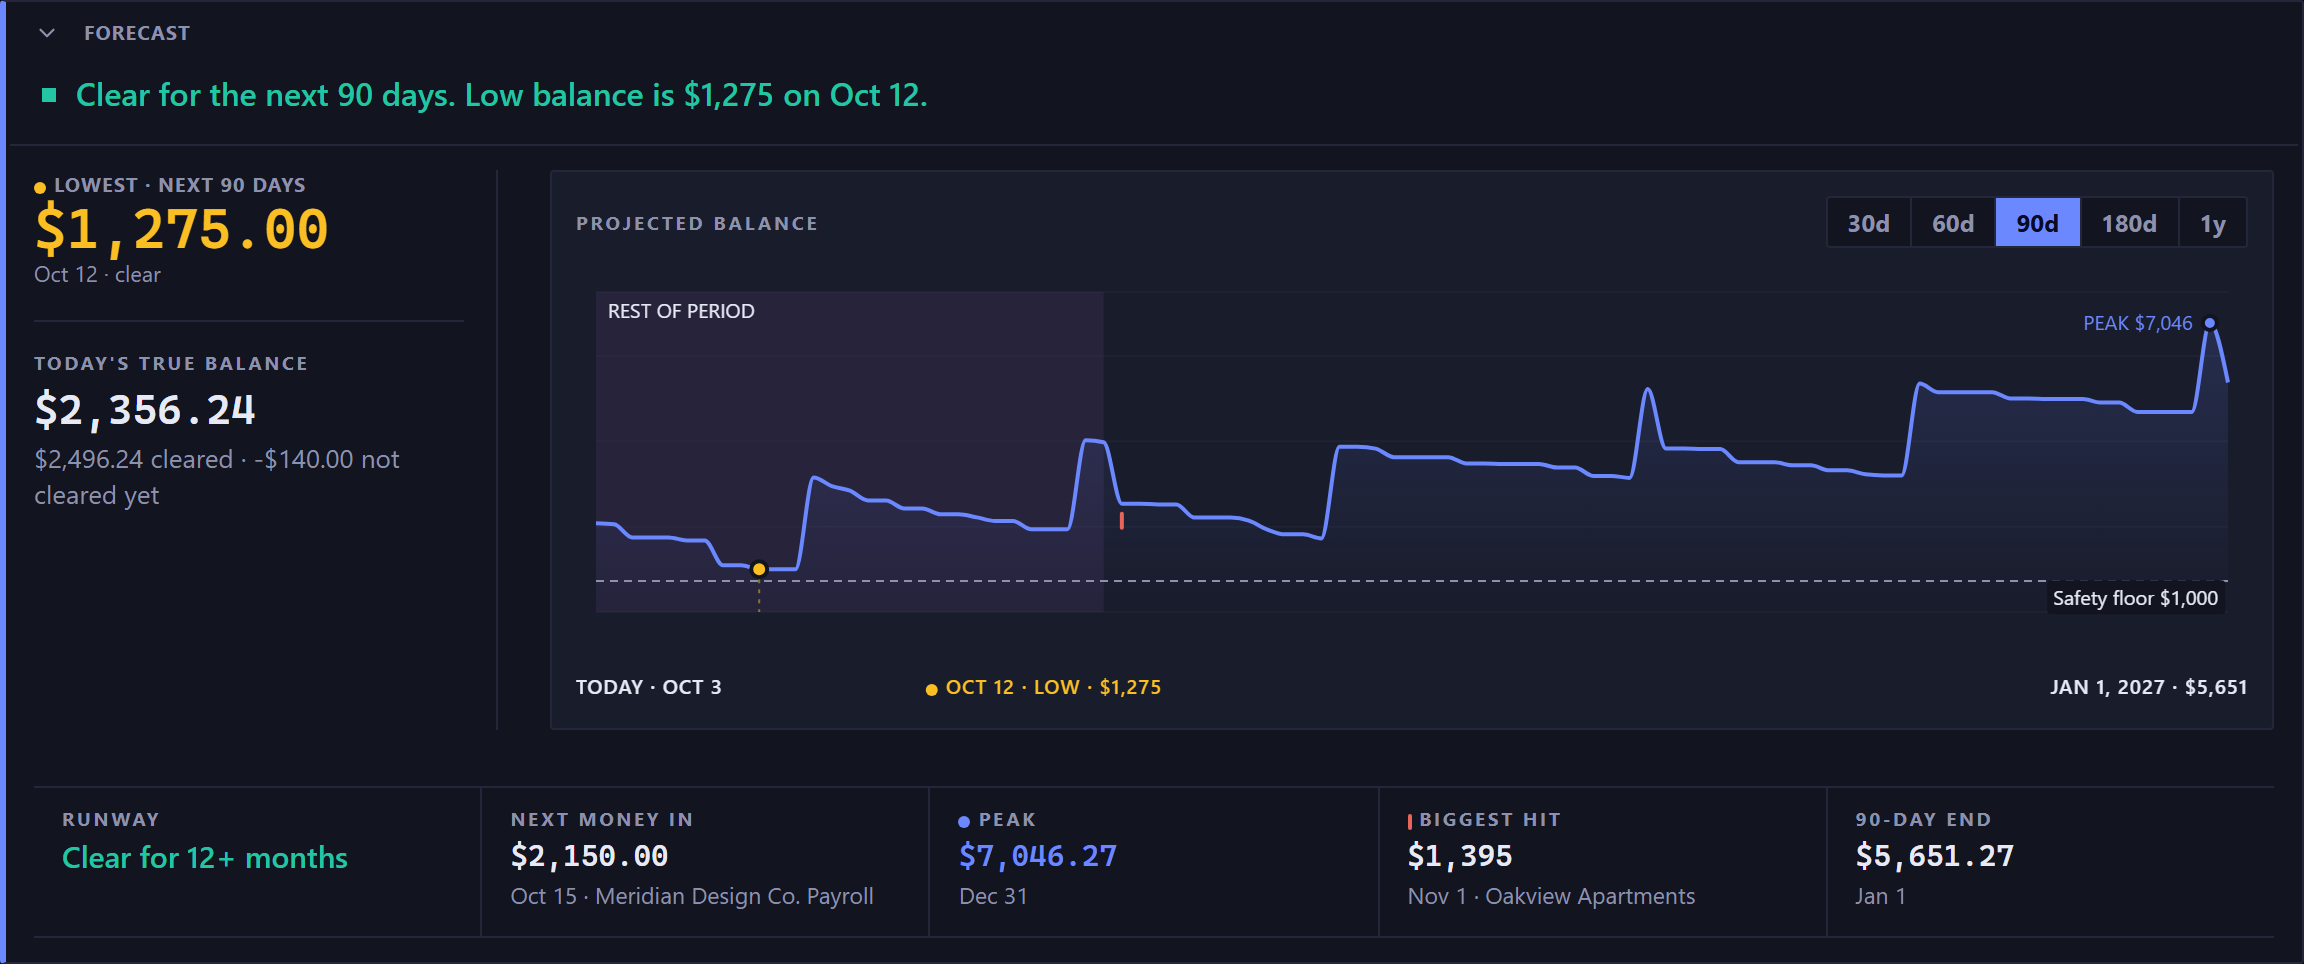
The forecast panel. A green square and a green sentence across the top read: clear for the next 90 days, then the low balance with its amount and its date. Below that the panel splits in two. A narrow left column carries the lowest point over the next 90 days, large and in the warning amber with an amber dot beside its label because the low is the thing to watch, with its date and the word clear; then under a rule and in smaller type, today's true balance, with a quieter line splitting it into what has cleared and what has not cleared yet. The rest of the width is the chart, labeled projected balance, with buttons for 30d, 60d, 90d, 180d and 1y and 90d selected. Its line starts at today, dips to an amber dot on the low early in the range, rises in steps on each payday and stays above a dashed safety floor with its amount marked; the peak is labeled in blue near the end, and a row beneath the chart names today, the low with its amount, and the end of the range. Across the bottom, a rail of five cells divided by hairlines, each one a small label over a figure, and every cell but runway with a quieter line of context beneath it: runway, clear for 12 plus months, in green; next money in, with its date and the payer beneath; the peak in blue with a blue dot, with its date; the biggest hit with a red tick, with its date and payee; and the 90 day end, the same figure the line ends on, with its date.The forecast panel. A green square and a green sentence across the top read: clear for the next 90 days, then the low balance with its amount and its date. Below that the panel splits in two. A narrow left column carries the lowest point over the next 90 days, large and in the warning amber with an amber dot beside its label because the low is the thing to watch, with its date and the word clear; then under a rule and in smaller type, today's true balance, with a quieter line splitting it into what has cleared and what has not cleared yet. The rest of the width is the chart, labeled projected balance, with buttons for 30d, 60d, 90d, 180d and 1y and 90d selected. Its line starts at today, dips to an amber dot on the low early in the range, rises in steps on each payday and stays above a dashed safety floor with its amount marked; the peak is labeled in blue near the end, and a row beneath the chart names today, the low with its amount, and the end of the range. Across the bottom, a rail of five cells divided by hairlines, each one a small label over a figure, and every cell but runway with a quieter line of context beneath it: runway, clear for 12 plus months, in green; next money in, with its date and the payer beneath; the peak in blue with a blue dot, with its date; the biggest hit with a red tick, with its date and payee; and the 90 day end, the same figure the line ends on, with its date.
The verdict, then the figures it came from.

The sentence is the answer#

The line at the top of the panel sums it up in one sentence: "Clear for the next 90 days. Low balance is $1,275 on Oct 12."

It turns amber when you dip below your safety floor and red when the balance goes below zero. On a credit card it talks about the most you'll owe, because there the danger runs the other way.

The low point#

The lowest your balance gets before it recovers, and the date it happens. A month that ends fine can still have a Thursday where the rent and the car payment overlap, and the low point finds it.

You may see two: one for the horizon you've selected, and one for the current budget period. The second only appears when it differs, so some days there's one figure and some days two.

Why runway can say 12 months#

Runway is how long you stay clear of your safety floor. On a credit card the same slot is called headroom, and it measures how long until you reach your ceiling.

Runway is checked a full year ahead, whatever horizon you've picked. So "Clear for 12+ months" can sit right above a 30-day chart: the horizon is how much you're looking at, and runway is how long until trouble.

The safety floor#

The floor is the cushion you want to keep, set per account on the Accounts page. Every warning is measured against it: the amber verdict, the cash crunch warning, the dashed line on the chart, and the red day on the calendar.

A floor of zero only warns you when you'd go overdrawn. Most people want to hear about it sooner.

On a credit card the same field is a debt ceiling. A loan has neither, and its panel becomes a payoff countdown.

When nothing is going out inside the window, the floor takes the Biggest hit's place among the figures, so you can see the cushion the line is measured against.

The chart shows the shape#

The small chart beside the figures has no axis numbers. It shows the shape of the next few months and where the low sits against your floor, and every exact figure is listed beside it in words. It marks the low and the peak with a dot and a figure, draws the safety floor as a dashed line, and shades the rest of the current budget period.

The chart view is the one to use when you want to read values, hover for a day's detail, or pin a point open.

New here? See what Forecast Commander does.