Year Wall
Video on YouTube:The Year Wall in Forecast Commander
A year of projected cushion on one screen, shaded against your own account's range, so you can see your tight weeks at a glance.
The screenshots are live captures of a demo account.
Last updated
A year of room, on one screen#
The Year Wall shows the next 364 days as one grid, one cell per day. Dark is tight and light is room, so you can see the shape of your year before you read a single number. A year that starts tight and gets easier reads as a slope from dark to light. A year where the same bills land on the same dates reads as bands.
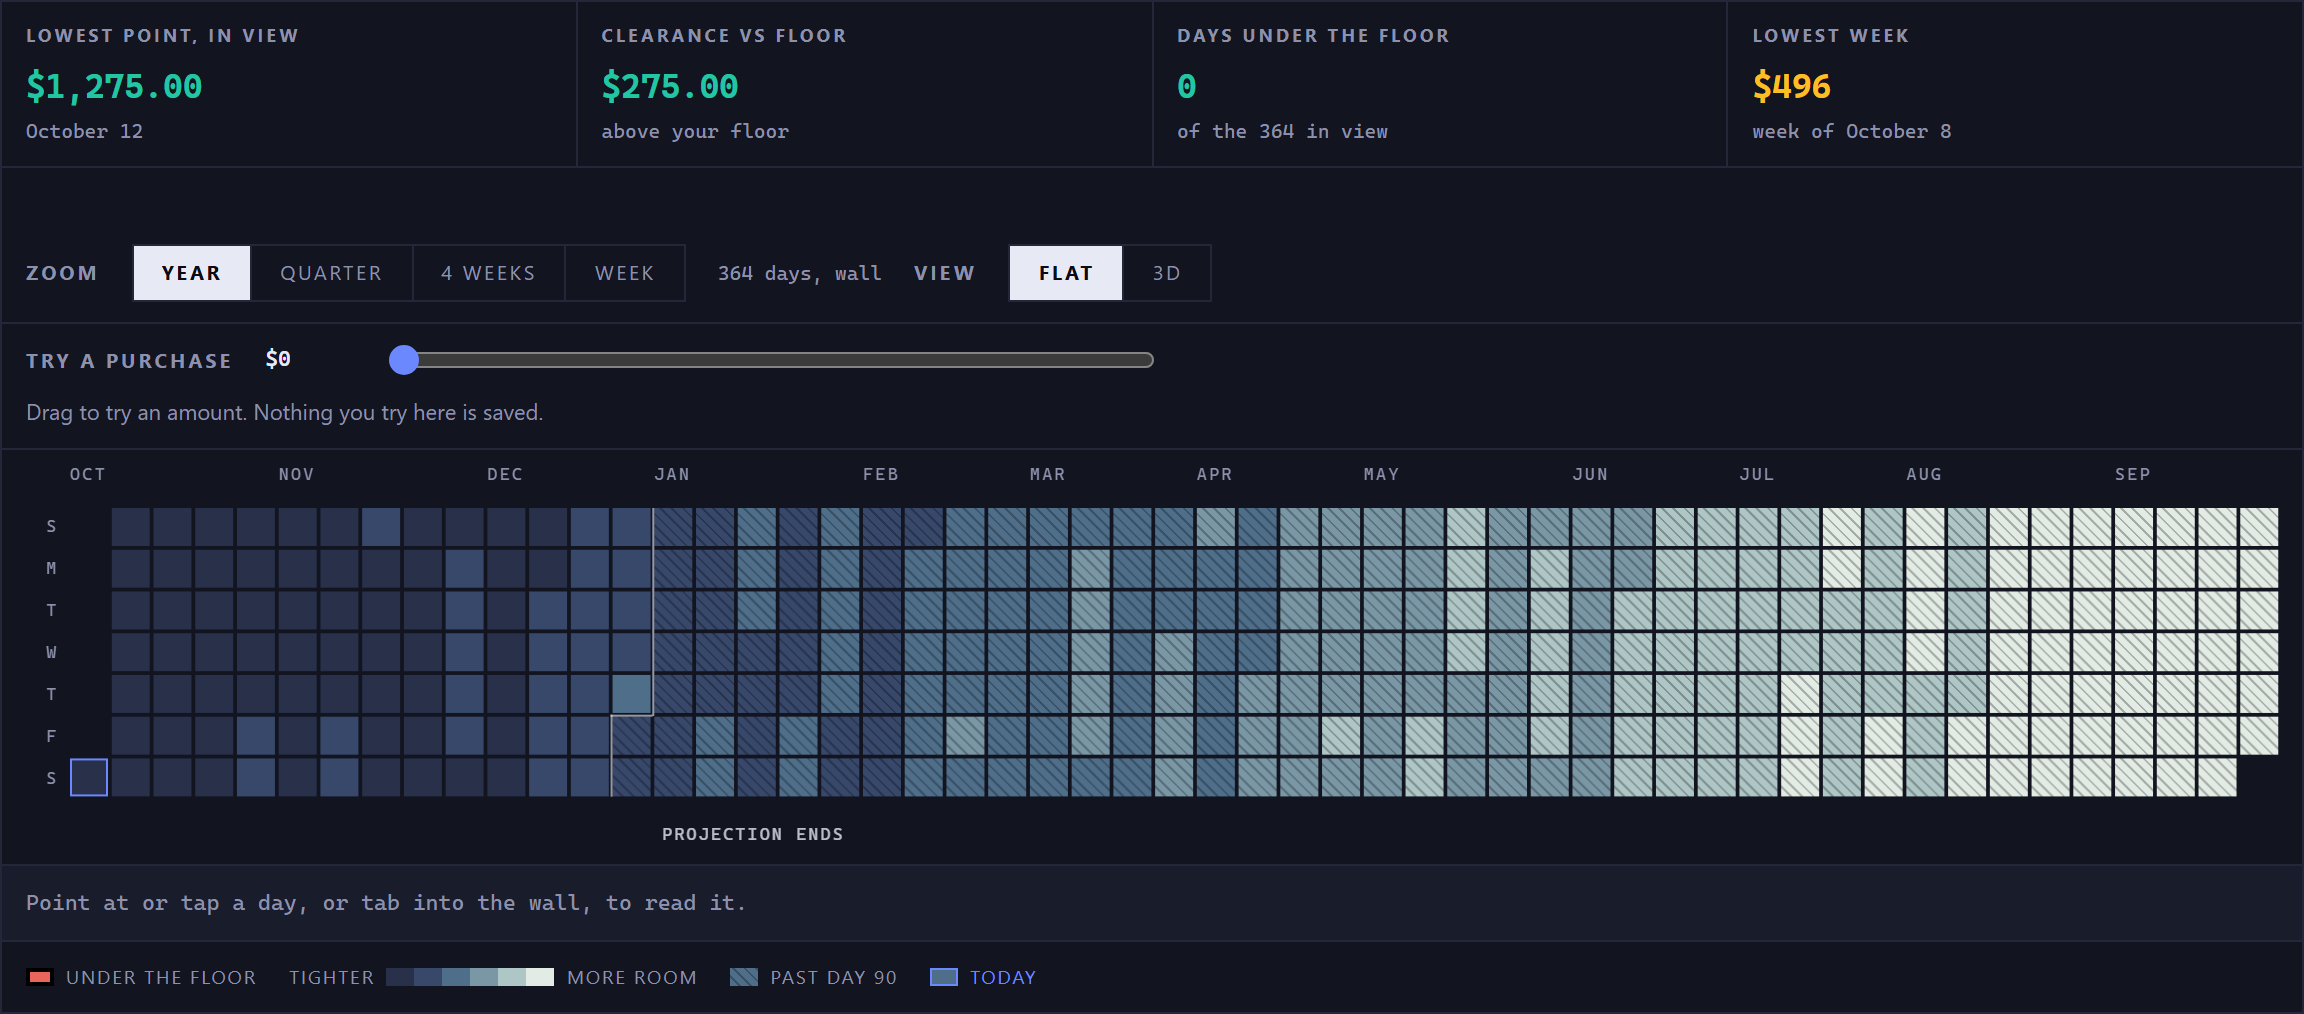
Each cell is shaded by that day's cushion: the projected balance minus the safety floor you set on the account. So the shading shows how much room you have above your floor.
Every account starts with a small default floor. Set the account's Safety Floor to the amount you want to keep on hand, because that's the line the shading is measured from. You'll find it on the Accounts page, on the account itself.
The shading is ranked against your own account#
Video on YouTube:The Year Wall in Forecast Commander from 0:45
A day's shade comes from where its cushion ranks among the days in view, so the colors aren't tied to dollar amounts. A large account and a small one both use the whole range of shades.
The one fixed color is for a day below your floor. It's always the alarm color, however the rest of the year looks, and it carries a ring around the cell, so you can find it without telling the colors apart.
Where the projection ends#
Video on YouTube:The Year Wall in Forecast Commander from 1:07
The projection is measured for the first 90 days. Past that, the days still count everything you've scheduled, but the further out a day is, the more can change before it comes.
So every day past day 90 is hatched, and a line labeled Projection ends marks where the hatching starts. The line steps around the week it falls in, so it matches the hatching day for day.
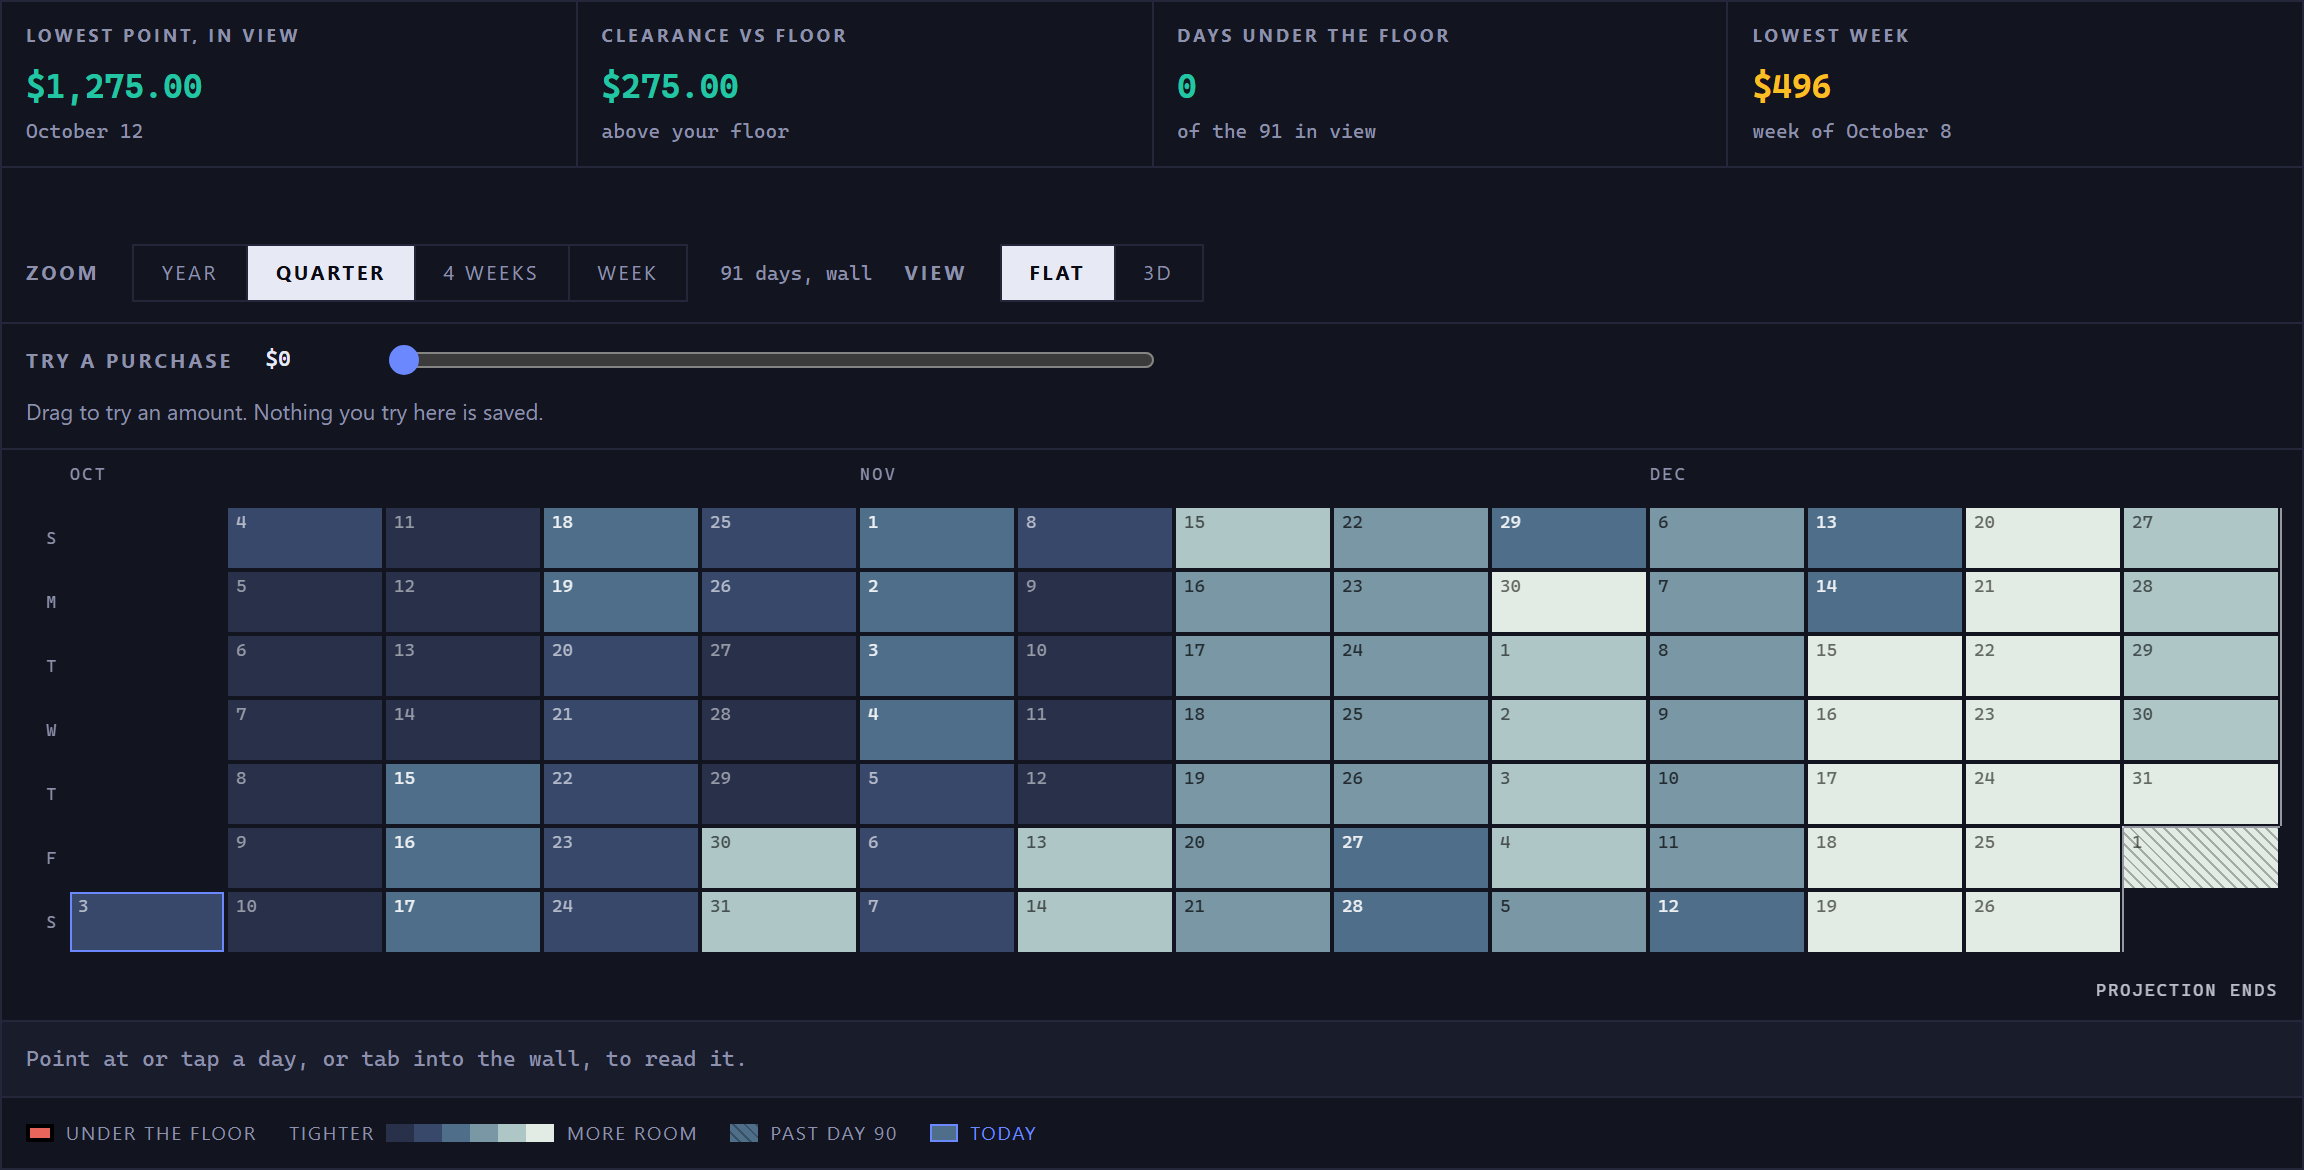
Zoom: Year, Quarter, 4 Weeks, Week#
Video on YouTube:The Year Wall in Forecast Commander from 1:24
The Zoom buttons choose how many days you see. The page opens on Year every time you visit.
At Year and Quarter the grid is seven rows deep, one column per week, so a tight week shows as a dark column. At 4 Weeks and Week it turns on its side into a seven-column calendar, and the same days move to their new places.
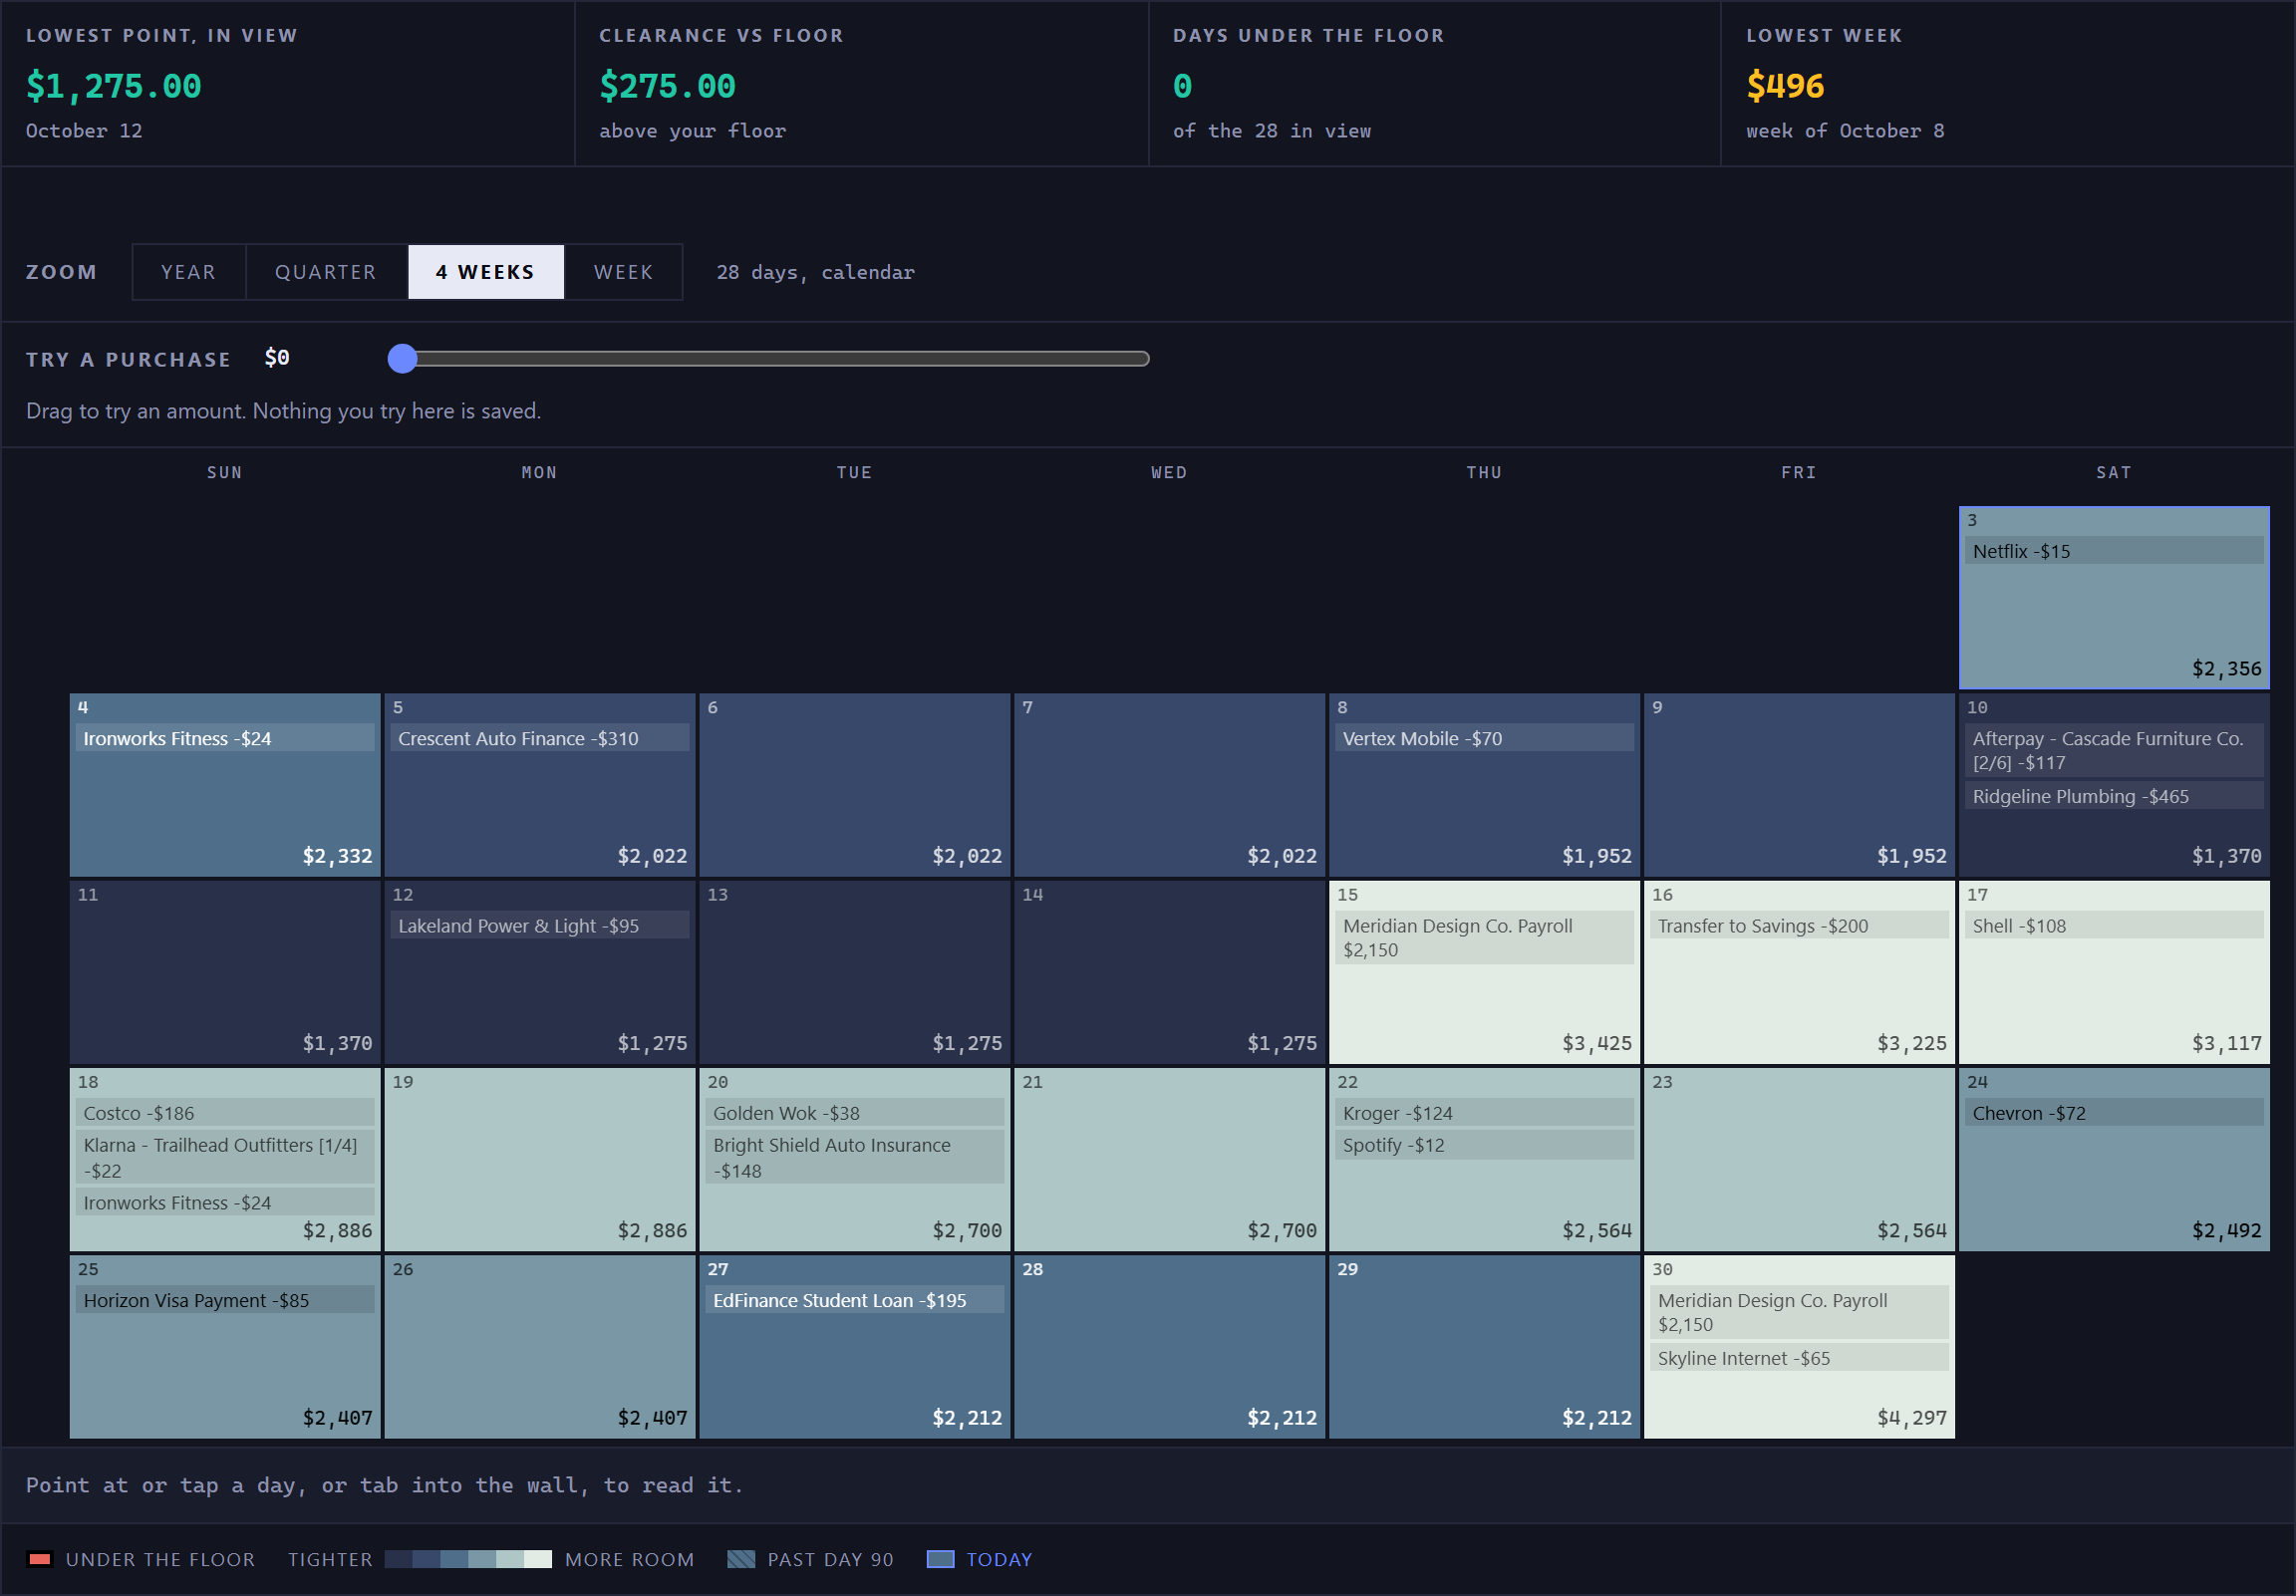
The bigger the cells, the more they show: first the date, then the names of what's due, then the amounts and the running balance. At 4 Weeks and Week on a tablet or a computer, every day shows all of it, up to four lines of what's due, and the rows grow to fit. A busier day shows its first three and a +N more line. Point at the day or tap it, and the strip under the wall lists everything.
On a phone the cells are too narrow for names, so they show the date and the color only. Tap a day, and the strip under the wall gives its balance, its cushion and what's due.
4 Weeks is today and the 27 days after it, so it usually starts partway through a week and runs into next month.
Seeing it in 3D#
Video on YouTube:The Year Wall in Forecast Commander from 1:55
At Year and Quarter, the View buttons switch the wall between Flat and 3D. In 3D each day stands up as a column, and the taller the column, the more room that day has. The colors are the same shading as the flat wall, the days past the measured projection keep their hatching, and a day below your floor keeps its warning color at the lowest height.
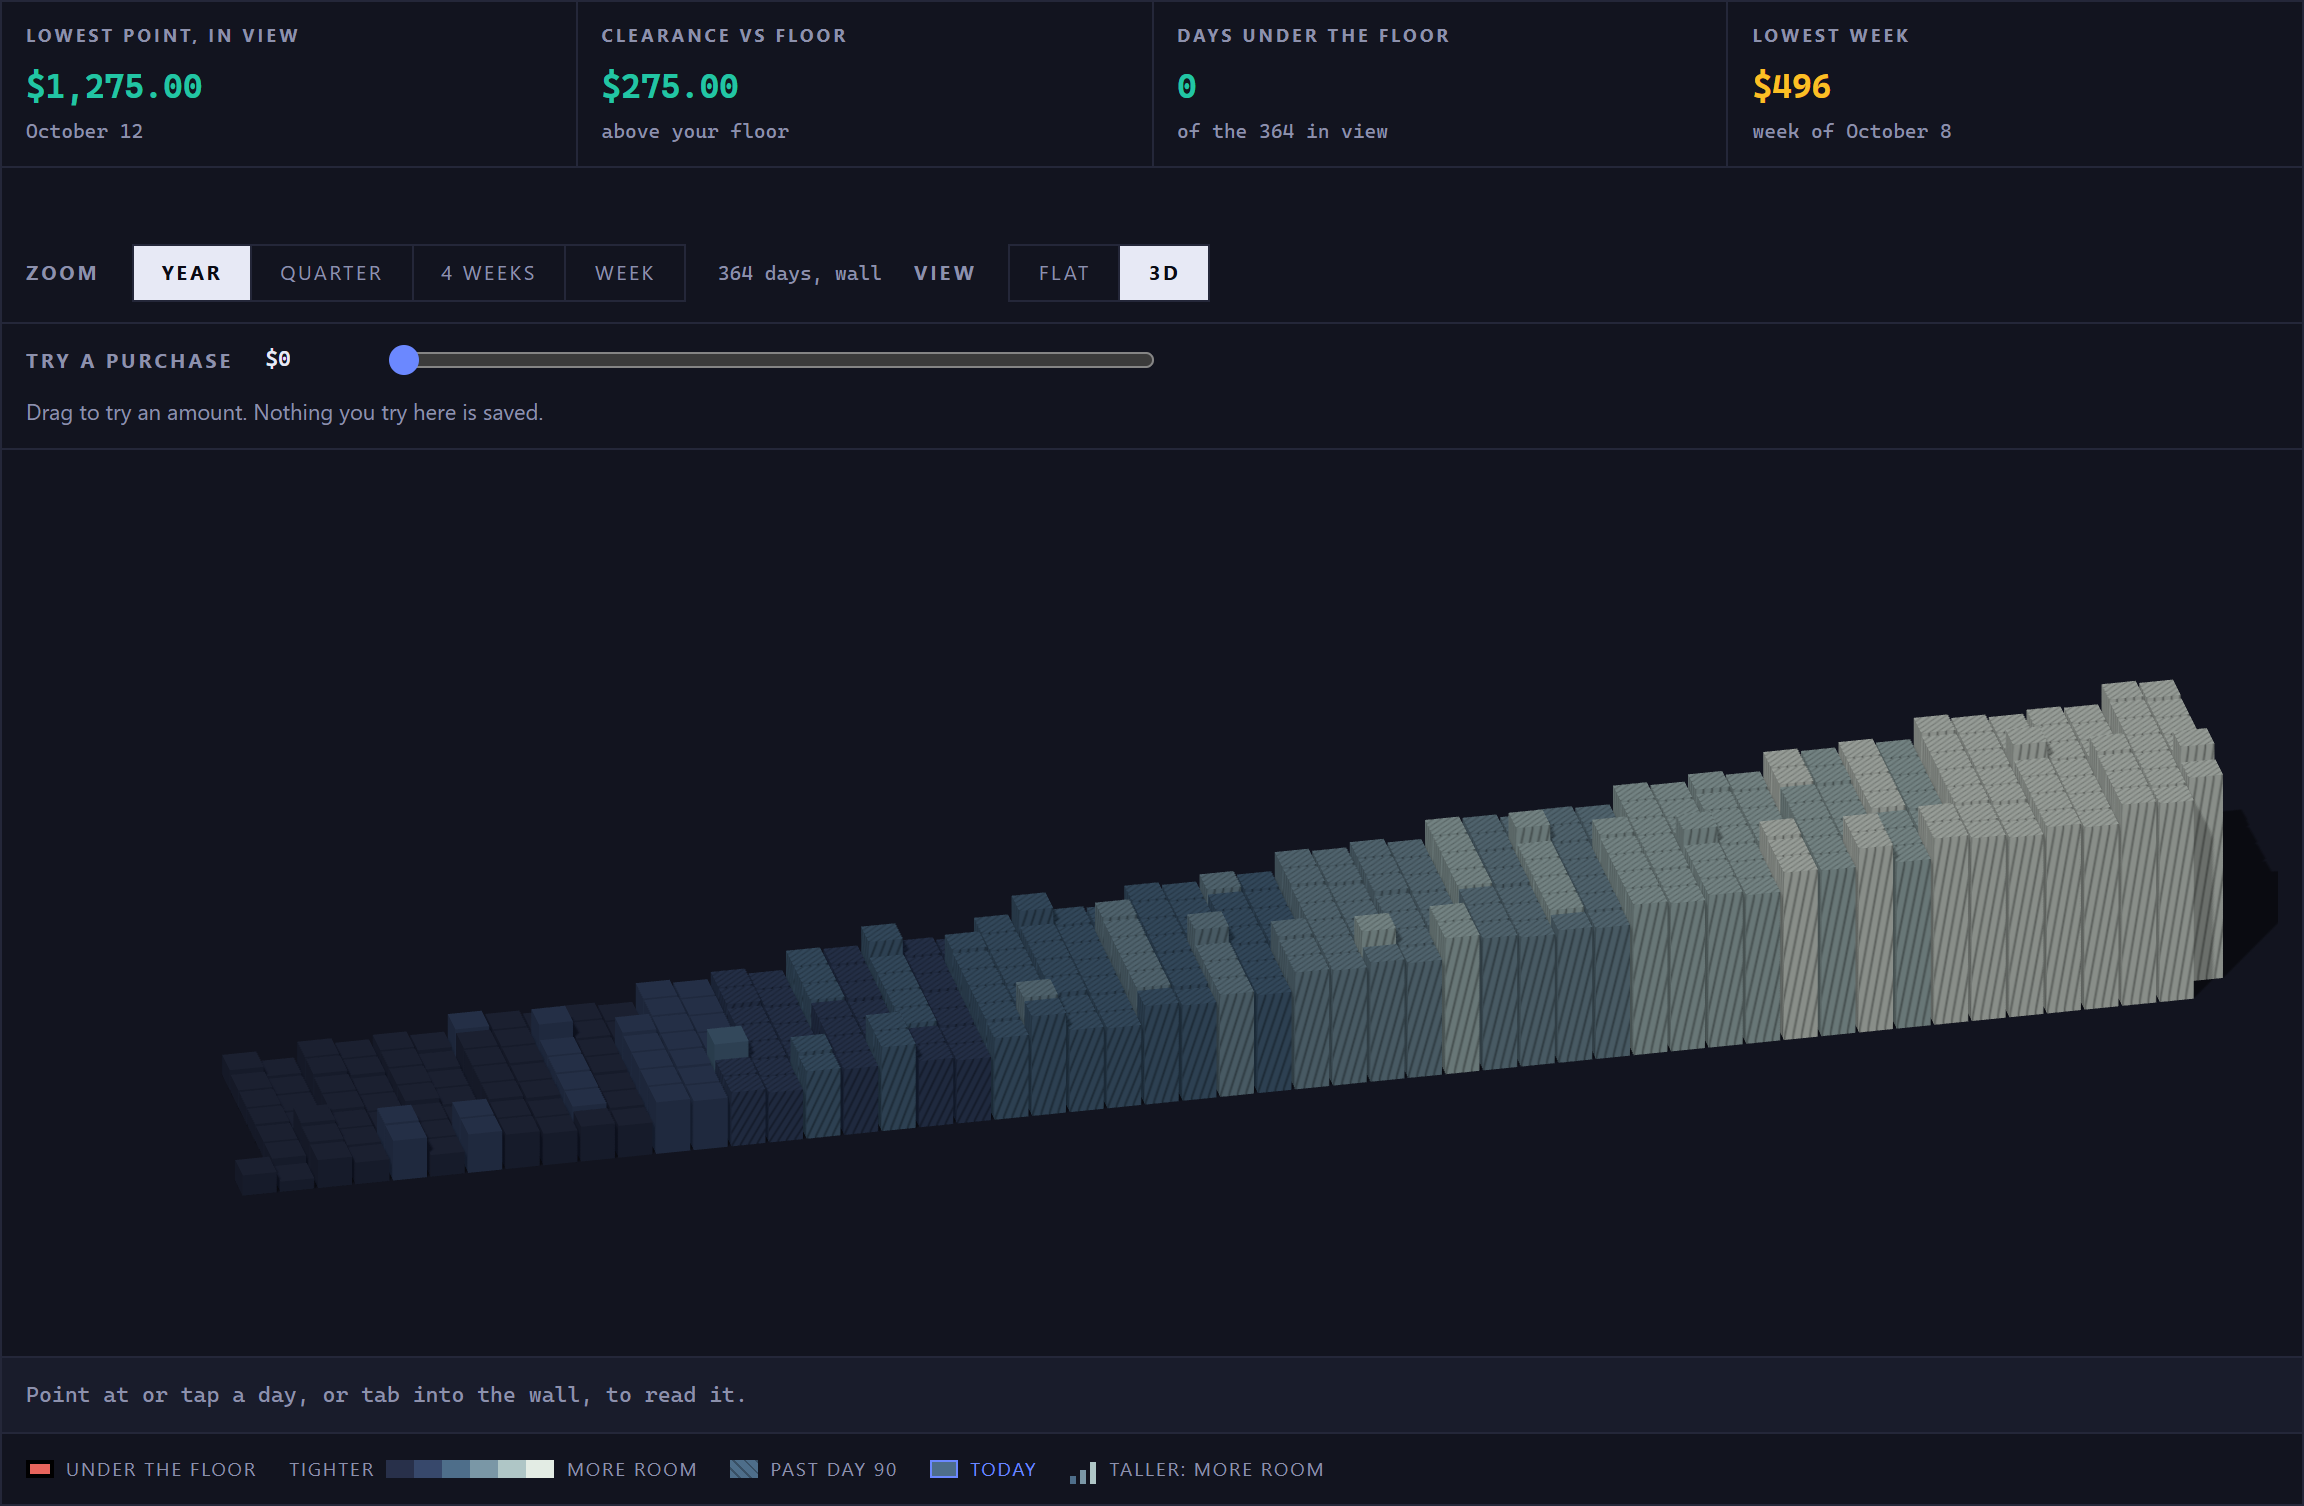
Point at a column to read it in the strip under the wall, the same as a cell. The keyboard still moves day to day, and the day you're on is outlined. Switch back to Flat whenever you like. Choosing 4 Weeks or Week does it for you, because those spans are a calendar. The page opens Flat each time you visit.
3D needs WebGL in your browser. If it isn't available, the page says so and the wall stays flat. If your device is set to reduce motion, the wall changes view without the animation.
Trying a purchase#
Video on YouTube:The Year Wall in Forecast Commander from 2:19
The Try a purchase slider asks when you could pay for something one-off. Move it to an amount, and the wall finds the first day that amount fits without your balance going below your floor. It's the same answer the When can I afford this? panel on the Scenarios page gives, worked out the same way, and the sentence under the slider uses the panel's wording.
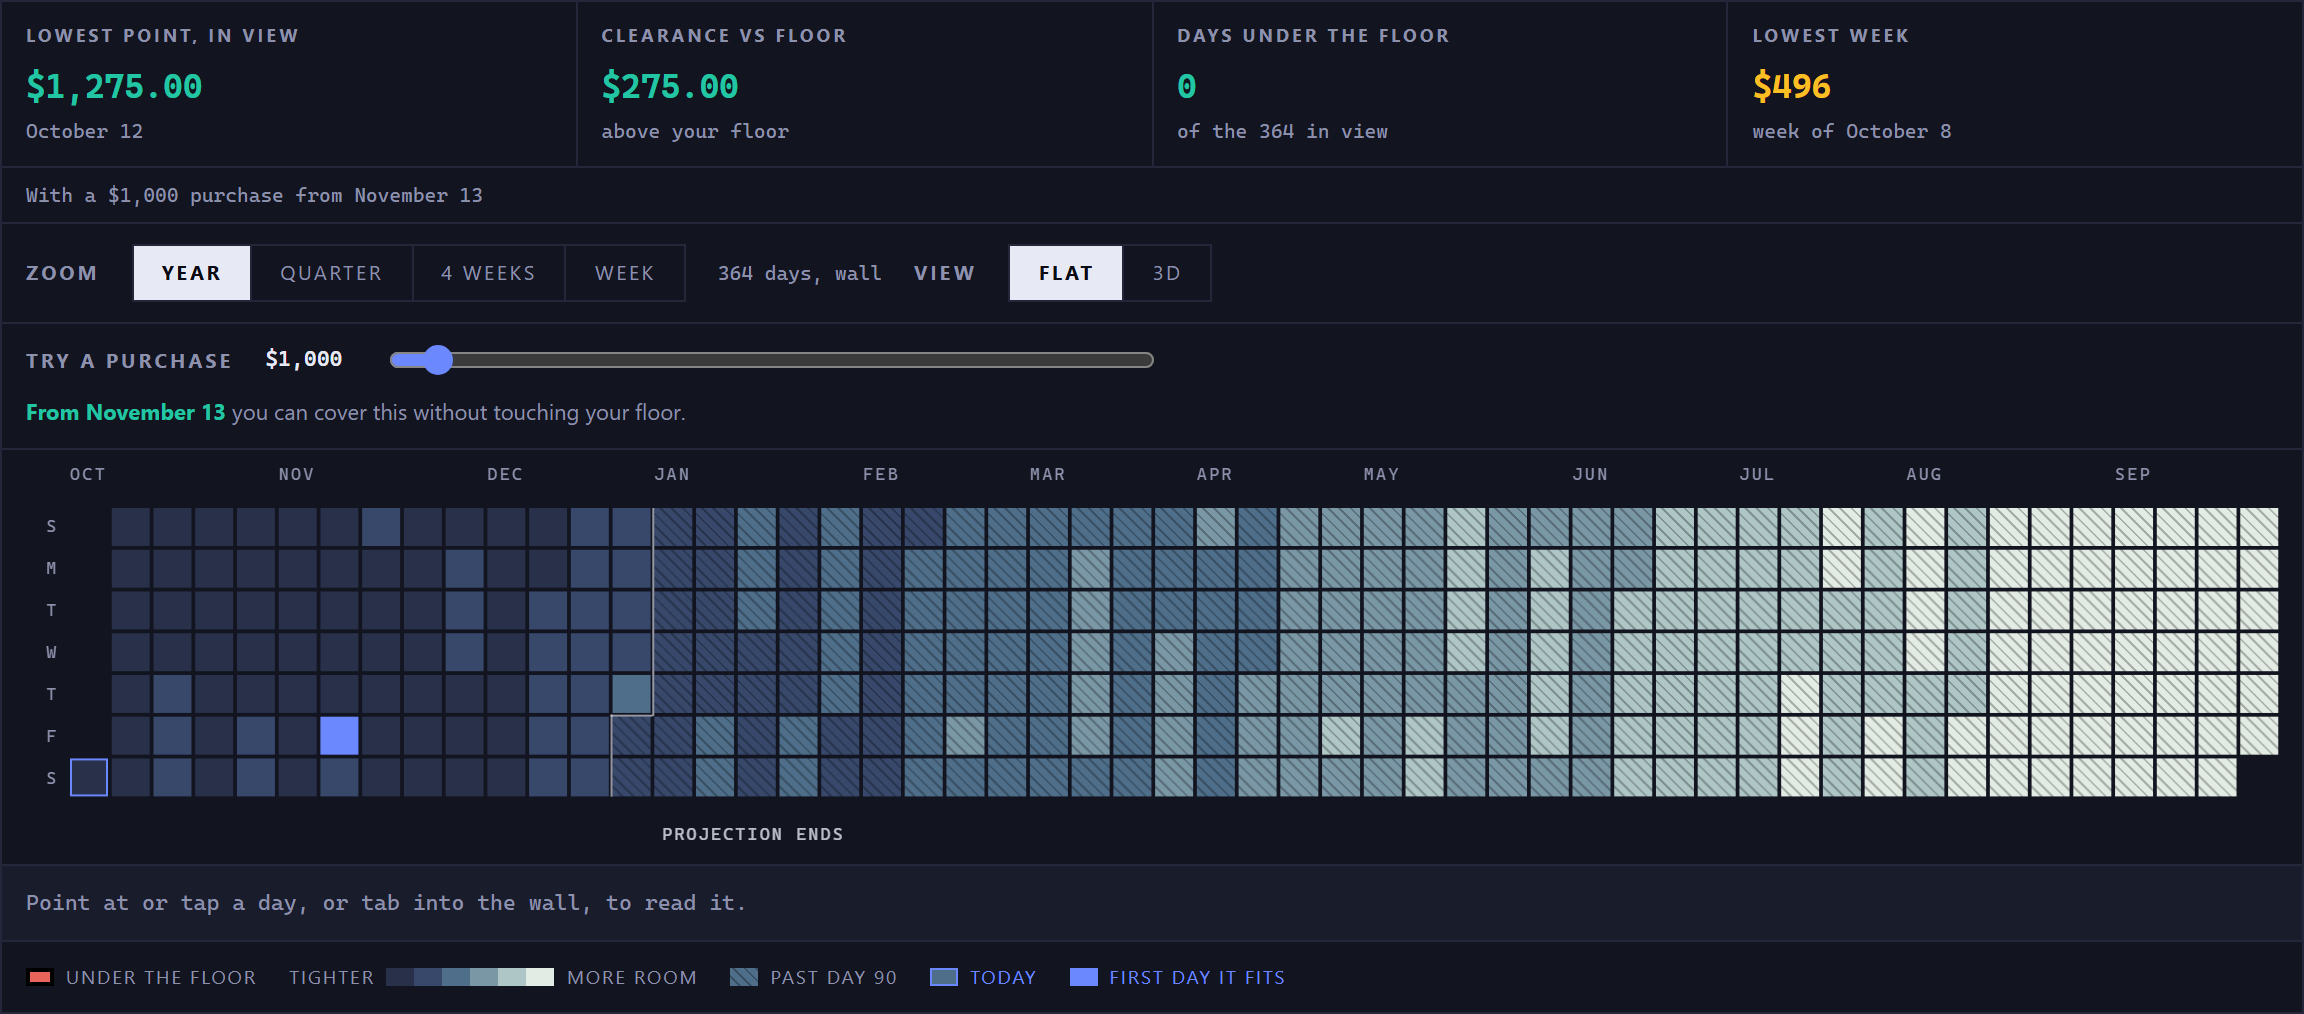
That day is highlighted on the wall, and every day from it onward is shaded as if you'd made the purchase. The four figures at the top count it too, and a line under them says so, naming the amount and the day it starts from. If the purchase fits today, the answer says so, and if no day in the next 12 months works, the answer tells you that.
The slider works in Flat and in 3D and leaves the view where you put it. The arrow keys change the amount a step at a time.
Reading one day#
Video on YouTube:The Year Wall in Forecast Commander from 2:48
Point at any day, tap it, or move to it with the keyboard, and the strip under the wall spells it out: the date, the projected balance, the cushion and what's scheduled that day. On a phone, that's where you read the amounts.
The keyboard works the way the Command Center calendar does. Tab once to get into the grid, use the arrow keys to move by day and by week, and Tab again to leave. The whole grid is one Tab stop.
A screen reader hears each day's date and figures, and today's cell says it's today, so nothing on the wall depends on color alone.
It follows the theme you already chose#
Video on YouTube:The Year Wall in Forecast Commander from 3:12
The wall uses the light and dark switch in the header, like every other page, and repaints when you change it. Each theme has its own set of shades, so the steps are easy to tell apart in both.
Where you make changes#
The Year Wall only shows your forecast. It reads the same projection as the Command Center, so the two always agree.
To work on a month, or to add and settle things, use the calendar on the Command Center.
The purchase slider saves nothing. A purchase you try lasts until you set the slider back to $0 or leave the page.
New here? See what Forecast Commander does.